Super Fan Facebook Graph
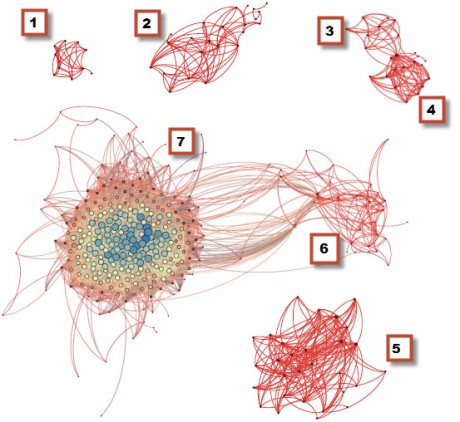
It’s pretty common to have a Facebook graph that consists of a few unconnected or only loosely connected clusters. In the visualization above there are distinct “constellations” of people I play cards with, people I worked with at Microsoft, people I am related to, people I went to high school with, and people I went to college with. Most of the people in those groups are fairly interconnected with each other but not at all connected to people in the other groups, or perhaps only loosely connected. For example the two nodes between 3 and 4 are my brothers who went to the same high school as me and therefore bring the high school and family clusters into proximity, but they aren’t connected to anyone I went to college with or have worked with in the past 10 years. Those clusters are the type of graphs I’d expect to see from the organic use patterns of a typical Facebook users, more or less.
So what’s with the really big blob? That’s the social network of someone who behaves like a very, very passionate fan of reality TV, in particular Big Brother and Survivor. I’ve been managing social media around theBig Brother Live Feeds for a while, and like my customers, I’ve connected to lots of stars and tons of fans. And all of those folks are connected to each other through multiple connections themselves. Over in constellation 6 are people I’ve worked with at RealNetworks, and the nodes connecting that group to super fan cluster are folks who work directly with customers, like our chat room moderators, my social media team, editors and video hosts, as well as some key folks in program management and operations.
Here’s the key if you’re curious
- Bridge players
- Microsoft friends (past gig)
- High school friends
- Family
- Knox College friends
- RealNetworks (current gig)
- Reality TV fans
Aside from the density of connections, you can see by the size of the circle which nodes are highly connected. The average number of connections in the graph is 55 but that average is thrown off by the folks represented by the very large circles, who have between 150 and 200 connections each. Some of those are stars who have been on the shows–and reality stars tend to be very accessible and connected on both Facebook and Twitter. They don’t just accept friend requests from fans, they will actively and frequently engage. However, it’s worth pointing out that some of the most connected members of my graph are just fans. They are the type of fans who will travel to Las Vegas after the season is over to party with the stars. They know each other very well and are as connected and influential in the fan community (and among my customer base) as any of the stars or casting directors.
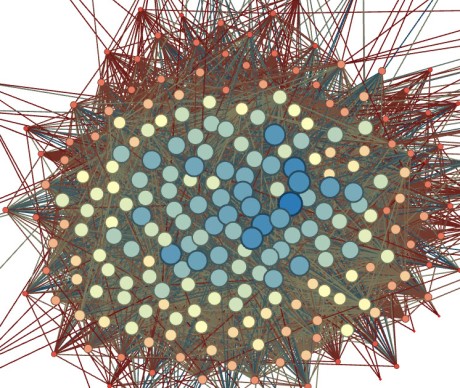
Here’s a close up of the Reality TV fans
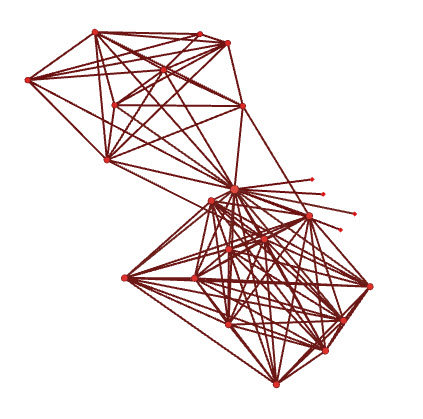
And here are the high school / family clusters so you can see just how much sparser the connections are
Note: This post was an extension of the first week’s lesson of the Coursera course Social Network Analysis taught by Lada Adamic. Thanks, Lada! The visualization tool I used is Gephi.
Performing Statements
No hay comentarios:
Publicar un comentario